“Switch over to your smartphone hotspot if you have Comcast,” the Slack message said. It was 9:45 pm on Monday, November 8th.
At first, it seemed like a childish prank, but it was coming from a legit source: our IT team. We were on a critical Zoom call, fine-tuning last-minute event details for the 'No Interruptions' product launch event scheduled for Tuesday morning.
“We are seeing cascading outages for Comcast users across Northern California; may impact you soon - the following message warned.
The disruption and subsequent coordination to get our work done would’ve been an unnecessary annoyance for us. In response to the alert, we shifted over to our hotspots and happily chugged along with our meetings while the outage rolled across NorCal.
Unscheduled, multi-hour ISP outages are uncommon these days, but when they happen, especially when most of us are working from home, the impact on productivity is significant.
The Comcast outage was a reminder to plan for unforeseeable situations. But how do you prepare for random outages?
In the digital experience monitoring (DEM) world, proactive monitoring is the best approach to staying ahead of unexpected outages and disruptions. But, the promise of continuous searching for signs of trouble is hard to believe until you see it in action.
The Comcast outage was an uncanny opportunity for the team that was putting the final touches on the launch of upgrades to our monitoring solution the very next day. So, how did the IT team pull it off? Let's look at how the team utilized cloud-native proactive monitoring to help us stay productive during the outage.
We use Zscaler Digital Experience (ZDX) within Zscaler to track and diagnose the performance of apps used by Zscaler employees. On the evening of November 8th, we began to see severe performance degradation, affecting multiple critical applications used by our employees. ZDX showed problem spots around the country, but a notable cluster in the San Francisco Bay Area. Given the concentration of our employees there, we decided to investigate. The ZDX score of these critical applications, while typically green, had dropped precipitously into the OK/poor category, accompanied by a sharp rise in page load times. See Figure 1.

Figure 1: ZDX score and Page Fetch Time show a significant drop around 9 PM PT (or 12 AM ET)
ZDX monitors the experience of each and every Zscaler employee, using them as “eyes” and “ears” to monitor application degradations. In this case, it saw anomalous behavior coming from areas of high Comcast usage, spread throughout the Bay Area. In Figures 2 and 3, we can see the experience of Zscaler employees before the outage and during the outage:
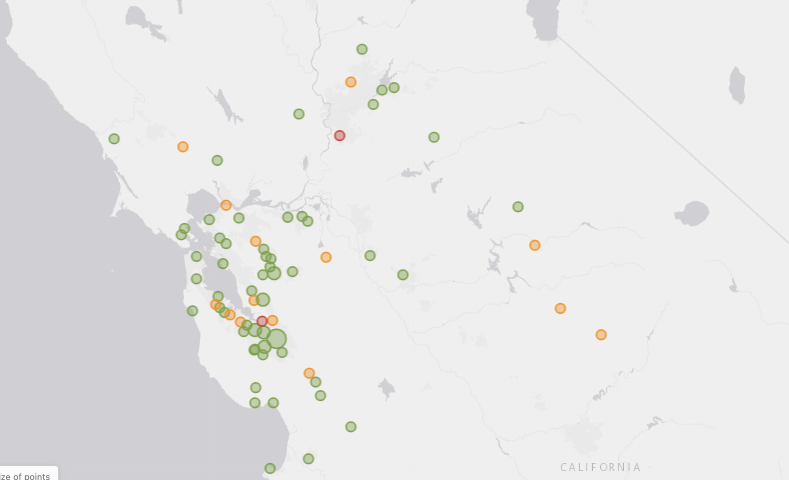
Figure 2: Zscaler employees in the Bay Area having good performance under normal conditions

Figure 3: Zscaler employees in the Bay Area experiencing the strains of the Comcast outage on the evening of November 8th, 2021
Once we identified that there were a significant number of employees in a concentrated region having problems, the next step was to isolate the cause of the problem. Since ZDX leverages the same agent that powers our cloud security solution, Zscaler Internet Access, (ZIA), we had access to a treasure trove of near-real-time data to analyze from across our employee base. ZDX measures from three different perspectives: the application, the network, and the user’s endpoint. Quick analysis ruled out the application and the user’s endpoint, leaving us with a network issue to further diagnose.
We examined data from ZDX CloudPath, which measures hop-by-hop latency and packet loss between a user’s endpoint and the application, and quickly isolated an ISP issue. CloudPath helped us rule out Wi-Fi issues, Zscaler cloud issues, and problems on the internet backbone. It showed us that each affected user was a Comcast customer and all of the degradation occurred between the user’s gateway and Comcast.
Figure 4 shows how CloudPath indicates the hop between the user’s gateway and Comcast to be at fault, showing excessive latency and loss (sometimes there was no connection at all). It also shows a healthy Wi-Fi (with minimal latency), and highlights that a connection downstream from Comcast to the Zscaler cloud was not possible.

Figure 4: This employee was able to establish a connection to Comcast, but with excessive latency and loss
We take the internet for granted, especially with most of the ISPs building highly resilient networks to deliver fast broadband connectivity to our homes. But, like any complex system, once disruption strikes, you get wildly unpredictable and degraded internet performance. Proactive monitoring combined with the network effects of monitoring from every user helps in providing a measure of control and predictability.
Check out Zscaler Digital Experience to learn how you can help your distributed workforce stay productive.


