
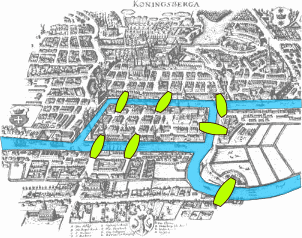
Graph theory has an interesting history, dating back to the 1700s when Leonhard Euler, who you might remember from Differential Equations in college, solved the Konigsberg bridge problem. The bridge problem involved traversing each of seven bridges arranged around an island and a fork in a river without crossing any of the bridges twice. If this question were posed today, it would be shared around on social media with half of the respondents incorrectly claiming to have solved it and the other half commenting, “who cares?”
Regardless, Euler proved that there is no such path over each bridge, thereby proving the first theorem in graph theory.
Understanding risk requires analyzing relationships
What does any of this have to do with security and why is it on the Zscaler blog?
Well, everything that we do in information security revolves around connections. The most obvious example of this is network connectivity. User A accesses Virtual Machine B which has access to Data Store C. But beyond simple network connectivity is a whole host of relationships amongst entities that can’t be captured simply by analyzing network configurations. Cloud permissions models, unpatched vulnerabilities, and cloud infrastructure misconfigurations are but a few of the many variables that create either desirable or undesirable connections across entities.
A simple analysis of discrete weaknesses in a system, such as your public cloud footprint, is not sufficient to understand the risk that your organization faces from bad actors. Much like the Konigsberg bridge problem, attackers will traverse a series of weaknesses (bridges) on their quest to get access to their target.
Enter graph theory, knowledge graphs, and our old buddy, Euler.
A knowledge graph illustrates the relationships between various entities. Knowledge graphs are commonly stored in an increasingly popular type of database known as a graph database. In many implementations, nice visualizations are built to make it easy for a human to see and understand the data structure stored in the database.
Applying knowledge graphs to public cloud security
Let’s take a look at a simple example. In an AWS deployment, we have an EC2 virtual machine running Linux, and, after a periodic agentless scan of that asset, it was determined that it had two unpatched vulnerabilities with a “critical” CVSS score. The question immediately becomes, “is this something that our team needs to act on immediately?”
With no context around the relationships between that EC2 VM and the broader set of entities in this cloud environment, it’s impossible to tell whether these vulnerabilities represent a risk to the organization or not. But armed with the knowledge graph, two things become possible.
First, the system can correlate across a broad range of weaknesses to apply a score and prioritization to the actual risk, allowing you to quickly compare this issue to the thousands of other issues facing your organization. This ensures that even the most resource-starved information security teams are always focused on the issues that will have maximum impact on risk mitigation.
Second, the team investigating the risk can quickly and easily identify the series of weaknesses that attackers are likely to exploit, typically mapped to a framework like Mitre ATT&CK, and systematically eliminate those weaknesses without trying to correlate information and alerts from several independent sources.
In this example from Zscaler’s CNAPP, Posture Control, we see the full spectrum of relationships that were determined by the underlying graph database and displayed for the user. Not only do we have the asset with unpatched vulnerabilities, but we can quickly determine network connectivity for the VM, who (and what) can access the VM, and what the VM itself can access.
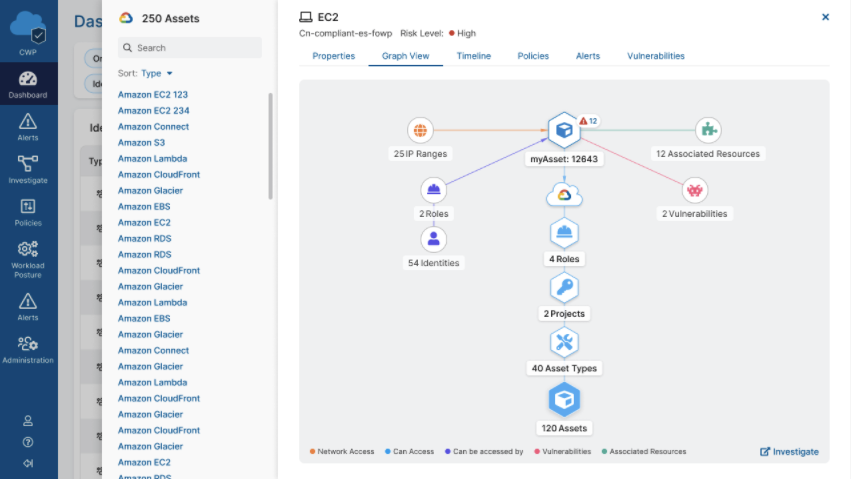
Fig: Posture Control - Risk Graph View
This data is leveraged directly in calculating overall risk and prioritizing this amongst other weaknesses in the organization’s multi-cloud footprint.

Fig: Risk Prioritization
If these capabilities sound like something you could leverage in your organization, I would encourage you to reach out and take a closer look at Posture Control, Zscaler’s Cloud Native Application Protection Platform.


