
This article originally appeared on CSO Online as part of the CISO 2.0 blog series.
In part 3 of our metrics series, we discussed we how KRIs help identify risks while KPIs help us measure them. In this, our final article in the series, we’ll build on this knowledge to create metrics based on our four-stage model for qualifying risks and threats that we introduced in part 2. By making your way through our sequential process, you’ll be able to extract performance indicators that can enlighten your executives on security risks and management.
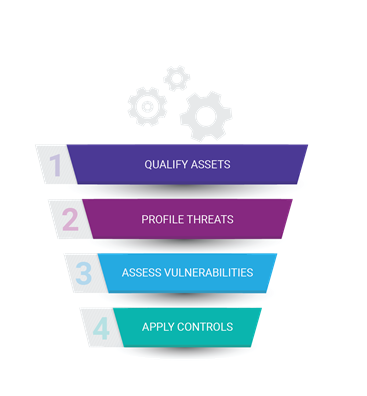
Figure 1 Four-stage model for qualifying risks and threats
For example, if we’re performing our Business Impact Assessments (BIAs) and we establish a maximum tolerable downtime, it’s the KPIs from our systems that keep us honest. If we have a KRI associated with “shadow IT consumption and data loss”, it’s our KPIs around the percentage of unapproved applications deployed across the estate that provide proof points. In summary:
- Business strategy tells you the direction the company is going in and how it will get there
- BIAs uncover the important assets necessary to support the strategy
- KRIs identify areas of risk which could prohibit a company achieving objectives
- KPIs measure and keep you honest
Sound confusing? I hope not – check out Figure 2 where I represented where and how business goals are mapped into risk and performance indicators:
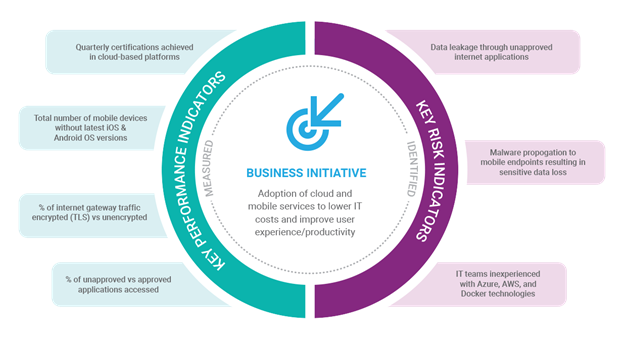
Figure 2 Business Initiatives translate into Indicators
Step 1: Qualify assets
We cannot apply the same level of security to everything (to do so would be very expensive and may increase friction in the user experience, which is unnecessary). We will apply stronger controls to systems and apps that contain stuff/data that we care about it.
To assess if we care about stuff/data, we leverage the BIA and data classification framework we discussed in above. This is where business continuity and security can align. In your BIAs, define location and technology stack inventory information for all systems that house confidential data, employee records, or systems where the confidentiality, integrity and/or availability requirements are “Critical/High.” Prioritize these first. The outputs of your BIA will give you pertinent information regarding the volume and sensitivity of data assets in your estate. The methodology varies but outputs generally include:
- Knowing how long you can afford to be without the data in question: Recovery Time Objective (RTO)
- Knowing how much data you can afford to lose in the event of a compromise: Recovery Point Objective
- Classification Requirements for Information: Confidentiality, Integrity and Availability.
When you are qualifying these assets, visibility is of paramount importance. We cannot protect what we cannot see. Challenges with visibility stem from four contemporary challenges:
- The rise of TLS traffic
- Multiple device types connecting to our network
- Cloud application consumption
- Increased regulatory and legal pressure
Let’s say you find 275 laptops in your environment that you don’t know anything about. There may be a legitimate business justification for these unapproved devices. If so, then you can build an argument for investing in a suitable control (which we discuss in step 4 below).
All too often, we exclusively think of an ‘asset’ as a physical device (laptops, phones); data are an asset too; Since we’re soon going to be forced to notify a supervisory authority within 72 hours of a known breach, a solid metric here would be a blue team exercise associated with some incident response scenarios which would provide stakeholder confidence that expedient report can be achieved:
- How long did it take to penetrate the environment?
- How long to discover data being ex-filtrated?
- How long before we had a public statement and briefed relevant board members?
Infosec Management has to be a holistic exercise, an imperative consideration being to secure your supply chain: Are you comfortable knowing who is connecting to your network? Let’s build a picture of who is connecting, using metrics associated with vendors who have passed a third-party due diligence process, and who have ISO 27001 certification.
- How many external repositories house personal data?
- How many suppliers have completed your vendor and supplier readiness questionnaire?
- % of suppliers who are PCI-DSS and ISO-27001 certified.
Reports suggest that 75 percent of the web will be encrypted by 2019. Given this, if your organization is still waiting to deploy TLS interception, perhaps we should look to get the visibility heat map flashing red! The total volume of web-traffic encrypted-v-unencrypted through Web and Email Gateways is always a good starting point to justify the need for TLS interception. If you need some assistance with your business case, check out some produced that shows the rise of threats in SSL.
Step 2: Profile threats
At this point, we know what we are protecting and we know who is connecting and from which devices. Next, we need to better understand who is attacking us. In an ideal world, the security professional would provide a percentage likelihood of a data breach, but in reality, cyber security presents a volume of variables that cannot be measured as absolutes.
For example:
- Attribution of threat actor location is onerous due to anonymizing services and botnets.
- Security control strength and application consistency varies across organizations.
- Forensic breach analysis information is not publicly provided.
That said, we can generally break down threat actors into two categories. We then develop metrics associated with the ‘tools, techniques and procedures’ (TTPs) that actor actor exhibits:
Accidental: Insiders, third parties, admins who make a mistake (who could forget the Amazon S3 debacle?) A solid metric here is your recovery point objective and recovery time objective – how long can you afford for a system to be offline? Which threat events could cause such an outage?
Adversarial: Who is attacking us? How well funded are they? Are they committed and capable? Are you able to review previous incident reports and identify the tools, techniques and procedures used? Are others in your industry being targeted by this actor? Are indicators of compromise (IPS signatures, file hashes, PCAPs) available which help identify malicious activity?
There is a lot of talk at the moment regarding threat intelligence, and understandably so. Is your organization pulling in threat intelligence information from open source or commercial providers? Are you participating in industry working groups? It is my view that no single organization can achieve a satisfactory understand of the threat landscape, companies must collaborate. It might feel like a truism but with the attackers only needing to be right once and the customer needing to be right all the time, we need all the help we can get. In any walk of life, collaboration and co-operation is almost impossible if we are speaking different languages; this has long been an issue with cyber information sharing. This series isn’t intended to deep-dive into cyber threat intelligence but I recommend that any organization interested in obtaining the most thorough picture of the cyber threat landscape as possible, looks to obtain feeds in a normalized fashion. The Structured Threat Information Expression (STIX) provides a standardized, machine-readable language for threat information exchange and follows a number of the language components I cover in this series (Actors, Events, Vulnerabilities, etc).
Step 3: Assess vulnerabilities
From my experience, assessing vulnerabilities is our biggest challenge. As security professionals, we talk about “people, process, and technology” often. Unfortunately, we focus too heavily on technology, nowhere more so than with vulnerability management. If we take an automated vulnerability scanner and point it at a network, invariably we’ll see metrics of a sort. But much is the response is a cacophony of noise – lot of warnings, with no way to prioritize them.
A great method for creating metrics on vulnerabilities comes from the tried-and-tested Common Vulnerability Scoring System (CVSS). You can see a visualization of that here on the FIRST website that breaks metrics down into three groups: base, temporal, end environmental metrics.
Under this rubric, the “Base Metric Group” represents the characteristics of a vulnerability, including exploitability and impact metrics. In the “Temporal Metric Group,” you’ll find characteristics of vulnerabilities that can change over time but do not cross over to the user environments. For instance, a simple-to-use exploit kit was present, this would increase the CVSS score; on the other hand, the creation of an official patch would decrease the score. The “Environmental Metric Group” includes vulnerability characteristics that are unique to your environment; this is where the infosec team earn their salary: through understanding the vulnerability and the methods by which it (vulnerability) can be exploited, we can assess if controls currently exist which mitigate or remove the threat. This process assists in removing the ‘alert fatigue’ associated with 254,000 systems need patching!
These metrics allow security team analysts to customize CVSS scores based on the importance of affected IT assets to the organization. The metrics are measured based on complementary or alternative security controls in place.
While it’s not quite the same as responding to the question, “Are we secure? ”, the scores are a method of saying that we have controls for threats. We might use CVSS scores within the security team, but we can also use them with a broader audience to assess the efficacy of a control and produce a temporal score – and in this way, provide qualitative feedback. I have worked with organisations who take CVSS scores (quantitative) and apply a traffic light system (qualitative) when reporting an aggregated view of their ‘threat landscape’.
Metrics for technology solutions are one thing. But how do we measure vulnerabilities in people and process? We could use end-user awareness training used to produce metrics, but do the measurements still apply? We used to use a percentage of users who clicked on links? In a world of drive-by-downloads, malvertising and rouge Domain Validated Certs, is it any longer fair to castigate users for clicking on dodgy links or being lured to legitimate looking websites? All is not lost, we can apply some metrics to the people and process side of infosec (although generally with the support of ‘technology’). Check out this post I wrote on the subject.
We spoke earlier in the article around the time taken to identify a data breach or malicious insider, that’s a pretty solid metric for infosec efficacy. Another one I’ve used in the past is number of high/medium vulnerability findings across a penetration test or application code review. Take this information and work with your development teams; help them understand what, say, Cross Site Request Forgery actually is and how to remove it from your code.
You cannot measure what you don’t manage, right? Establish baselines for each of your operational activities and ensure that these are adhered to. I have always been a fan of the ISO 27001 Information Security Management System (ISMS). If you’re applying a governance model of policy, standard, guideline then why not leverage your automated vulnerability scanner and report on technical non-compliance to your guidelines?
Let’s talk about risk management processes: how many exceptions are you having to raise? Why? Does the policy or standard need to change? Given that our policies are driven from a series of business requirements, reporting an aggregated view of how well your organization complies with policy is a fantastic metric! Remember, security is iterative. If a policy isn’t working, or the implementation of a control is overly onerous, reevaluate!
Step 4. Apply controls: coverage is key, visibility is essential
When considering controls, ask yourself, “Is it worth it?” from a cost perspective or from an efficacy-of-solution perspective.
Controls are there to lessen the impact or likelihood of a risk occurring. Controls do not have to be absolute. It’s unusual for a control to remove a risk entirely. We’re looking to lessen the risk to a palatable level. Who sets this bar? It’s the business!
Organizations may decide that they prefer a less-effective control that offers 100% coverage of users and data, rather than a more effective system that doesn’t cover them well at all. Questions (which can be applied as metrics) I like to ask myself when considering a control:
- Will it cover all locations: Head office, branch locations, mobile workers?
- Can all my users benefit?
- Does the control have technical prerequisites: OS version, hardware requirements?
In a world of cloud computing and digital transformation, how useful is a datacenter, appliance-based sandbox if my users work from home 80% of the time and their applications reside on the internet? What’s the efficacy of an agent-based EDR platform if it only runs on Windows and 30% of my estate are Mac consumers?
A lot has already been written regarding ‘return on investment’ (ROI), specifically in relation to cyber security. Surely an investment has to, ostensibly or otherwise, produce profit/returns. No security control is ever going to return a profit. Controls exist to prevent a loss! You wouldn’t be happy if, after five years, your savings account returned you exactly the same amount of money as you invested but in the world of cyber controls, that would be an unreserved success.
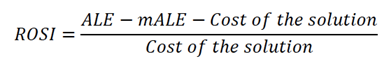
ENISA has drafted some excellent guidance on ROI in a security context. They too suggest that security controls are not an investment in a traditional sense. They suggest a specific “Return on Security Investment” (ROSI) which answers some tough questions:
- Are you paying too much for your cyber security?
- Are you investing in appropriate controls?
- Are you obtaining value.
The model is predicated on understanding how often incidents occur and their impact when they do. For this, we need to get to grips with some rudimentary risk concepts:
Single Loss Expectancy:
Monetary value of an isolated incident – ransomware attack, DDoS, loss of sensitive information. We consider hard and soft costs here – Fines, time to cleanup (hard) and brand reputation, reputation (soft)
Your SLE will vary across organisations; much like impact of a vulnerability (CVSS section). This depends on existing control set, business objectives (important again).
Annualised Rate of Occurrence (ARO):
ARO looks at the frequency of an event occurring. We can review historical information and use the more qualitative skills of our Subject Matter Experts (SMEs).
Annualised Loss Expectancy (ALE)
A simply equation can be used for our Annualised Loss Expectancy:
ALE = ARO x SLE
Armed with these figures, we have metrics associated with the untreated exposure. How then to assess if it’s a valid investment to apply controls.
Establishing Security Value
Our goal is to lower the ALE. We apply technical and operational controls to achieve this. So – if ALE is our inherent exposure, we have a modified ALE (mALE) which looks at the residual risk once we apply our control(s):
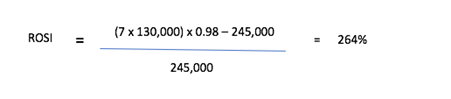
Let’s run through an example. Acme.com are considering the purchase of a malware sandbox. Each year, they’re hit with 7 serious crypto ransomware attacks; a major issue for productivity and a burden on the security function; each incident costing Acme approximately $130,000 in productivity and data. The sandbox solution in question has been tested against various industry benchmarks and a mean % of polymorphic threats caught is 98% - we call this our ‘mitigation ratio’. Total annual costs for the Sandbox (purchase + staff training) is $245,000. For this solution, our equation for ROSI clearly shows that a sandbox is a valuable addition to Acme’s cyber capabilities framework:
In closing, firstly I’ll say thank you. This piece was intended to be a lightweight ‘two-parter’, I’ve written four articles and could easily elaborate on most of these areas. In summary, applying metrics to information and cyber security is tough. It’s impossible if we don’t understand the businesses we are trying to protect; not everything can be quantitative but this is why we employ experts in cyber security and risk management to advise on the more subject aspects of our industry.
There are huge amounts of content I have left out of the series, please drop me a line on Twitter or find me on LinkedIn!
To catch up on our “Engaging with the C-Suite” series, read Part 1 here, Part 2 here, and Part 3 here.


